Kapost Gallery Analytics
The Kapost Gallery is the software application that focuses on the distribution of marketing content. During distribution, users want to know how the content performs and if they are sharing the right assets, and today, they have no way of knowing.
Goal: Show how content is performing in a quick and digestible design so consumers of the Gallery can make a data informed decision of what and when to share to prospects.
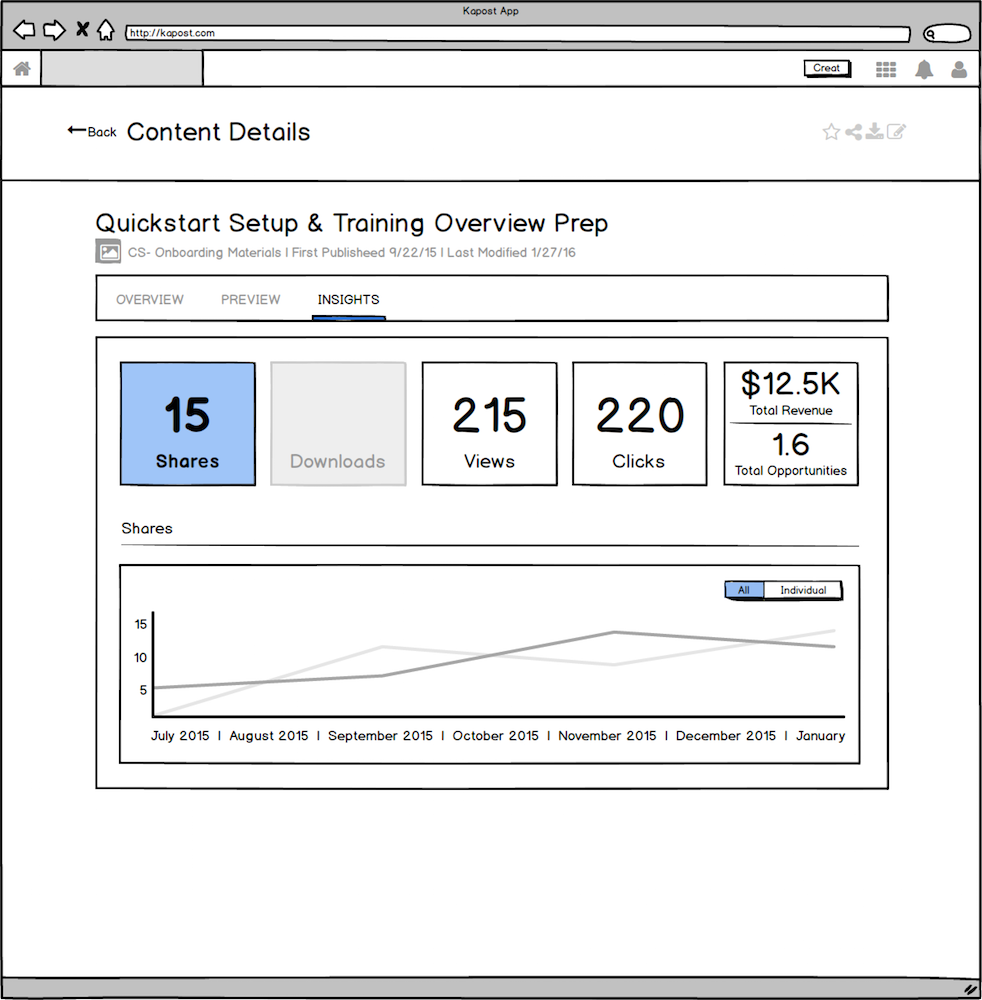
I was brought in by the Director of UX Design at Kapost towards the end of the brainstorming stage of the project. I worked with them and two Product Managers to create the final wireframes with Balsamiq and through the rest of the project:
After the brainstorming stage, I brought this idea to early hi-fidelity mock-ups to be tested with both our internal sales team and some of Kapost's customers.
We did three rounds of internal testing with various team members and roles, and had three external customer calls and visits, consistently iterating from their feedback of what statistics users are looking for, how granular they should be and in what order to show them.
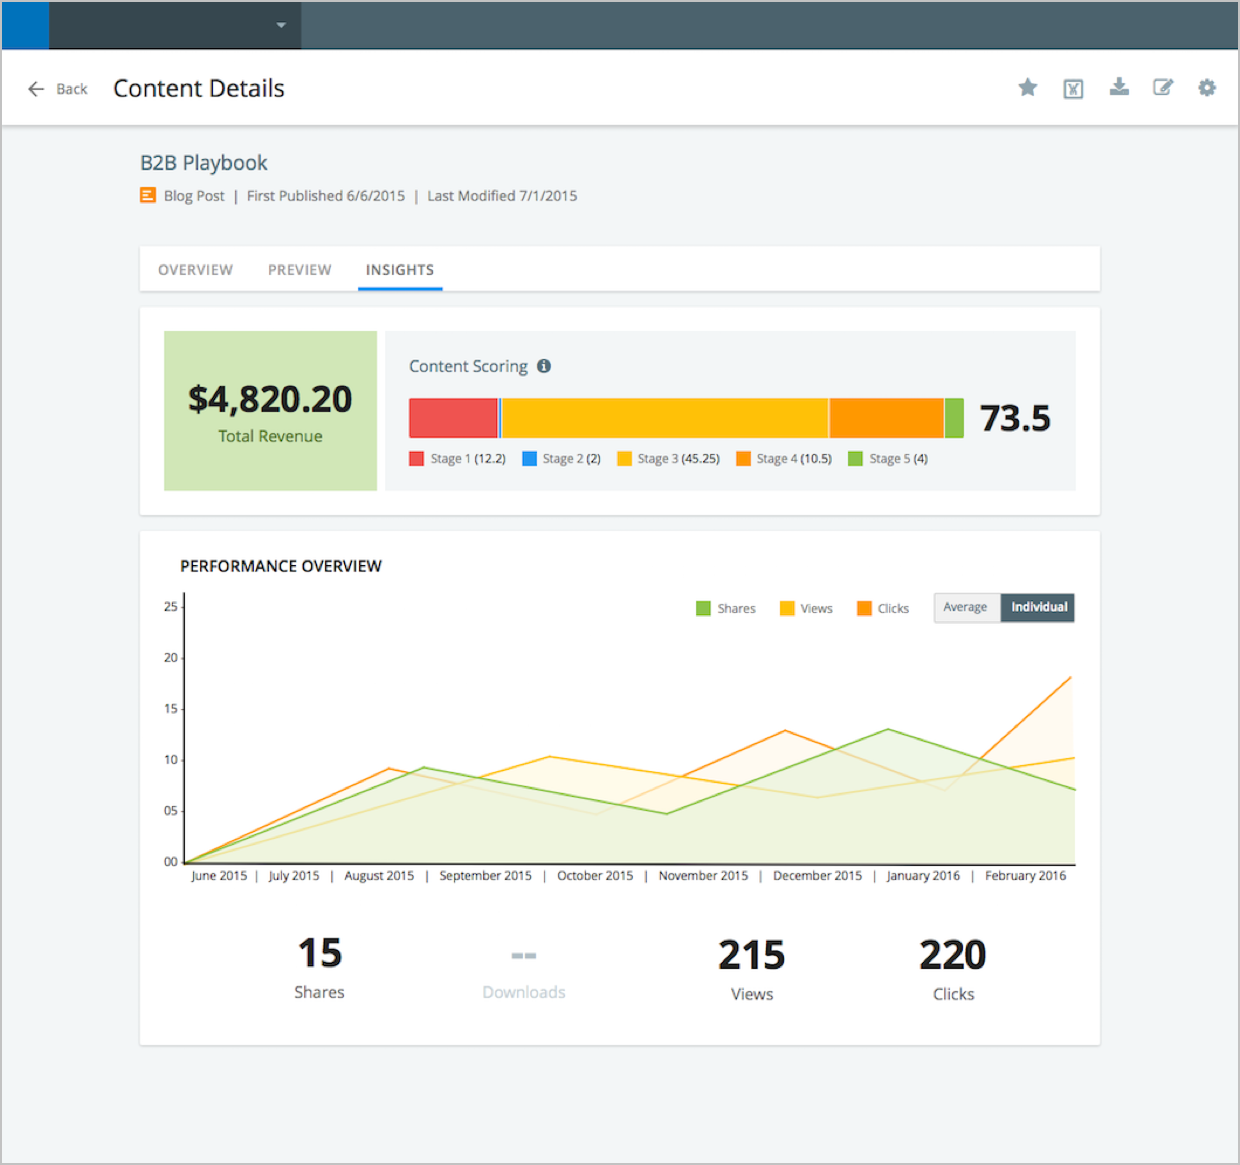
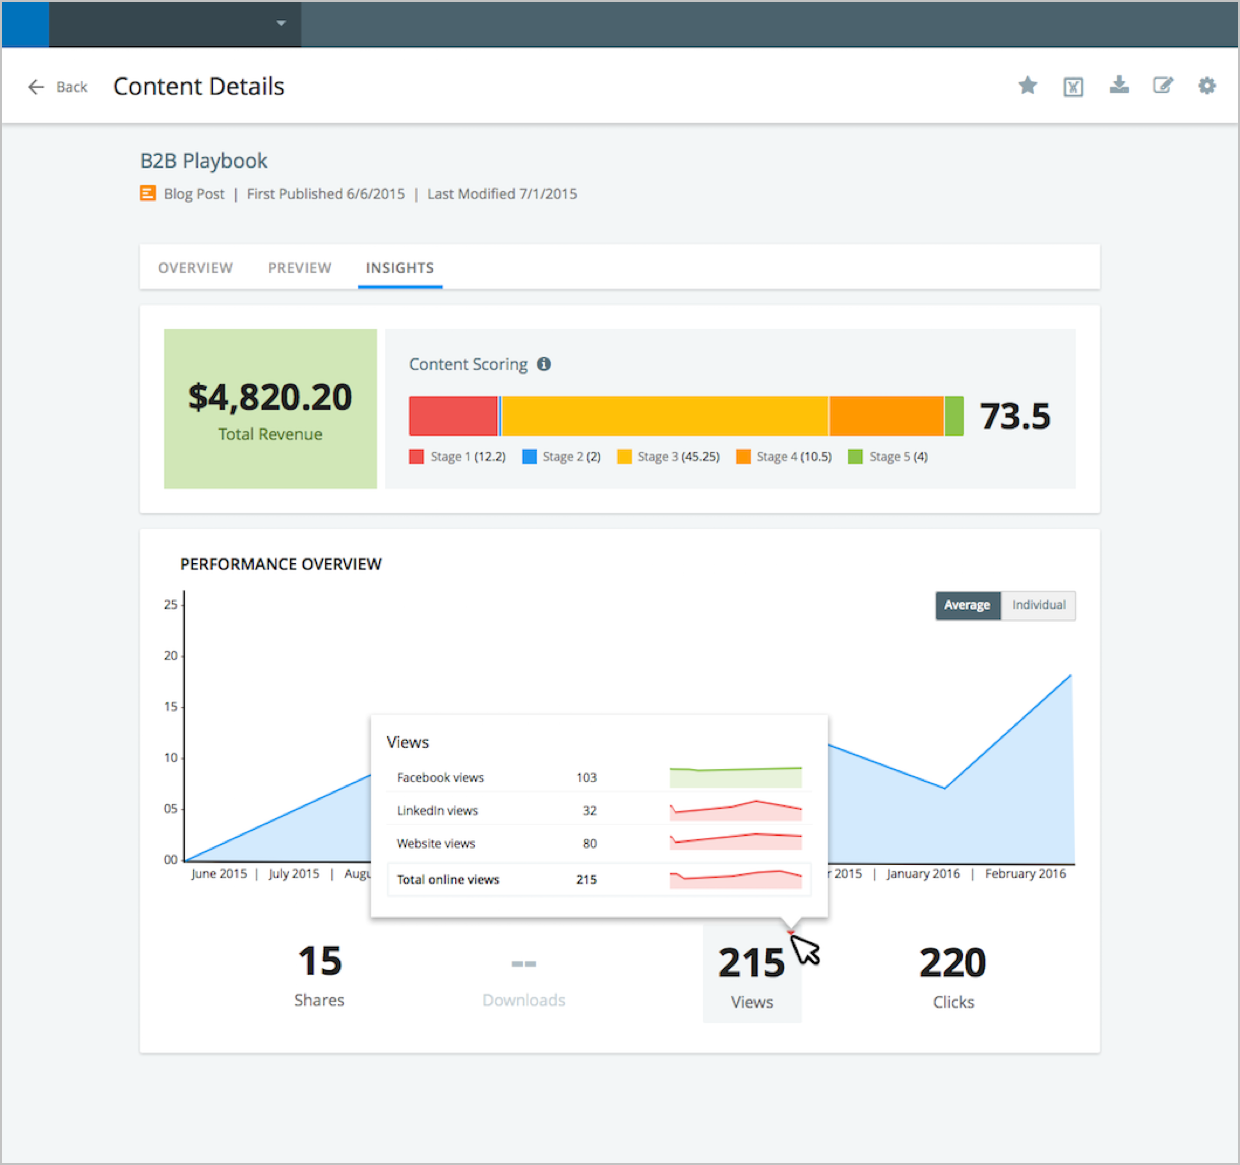
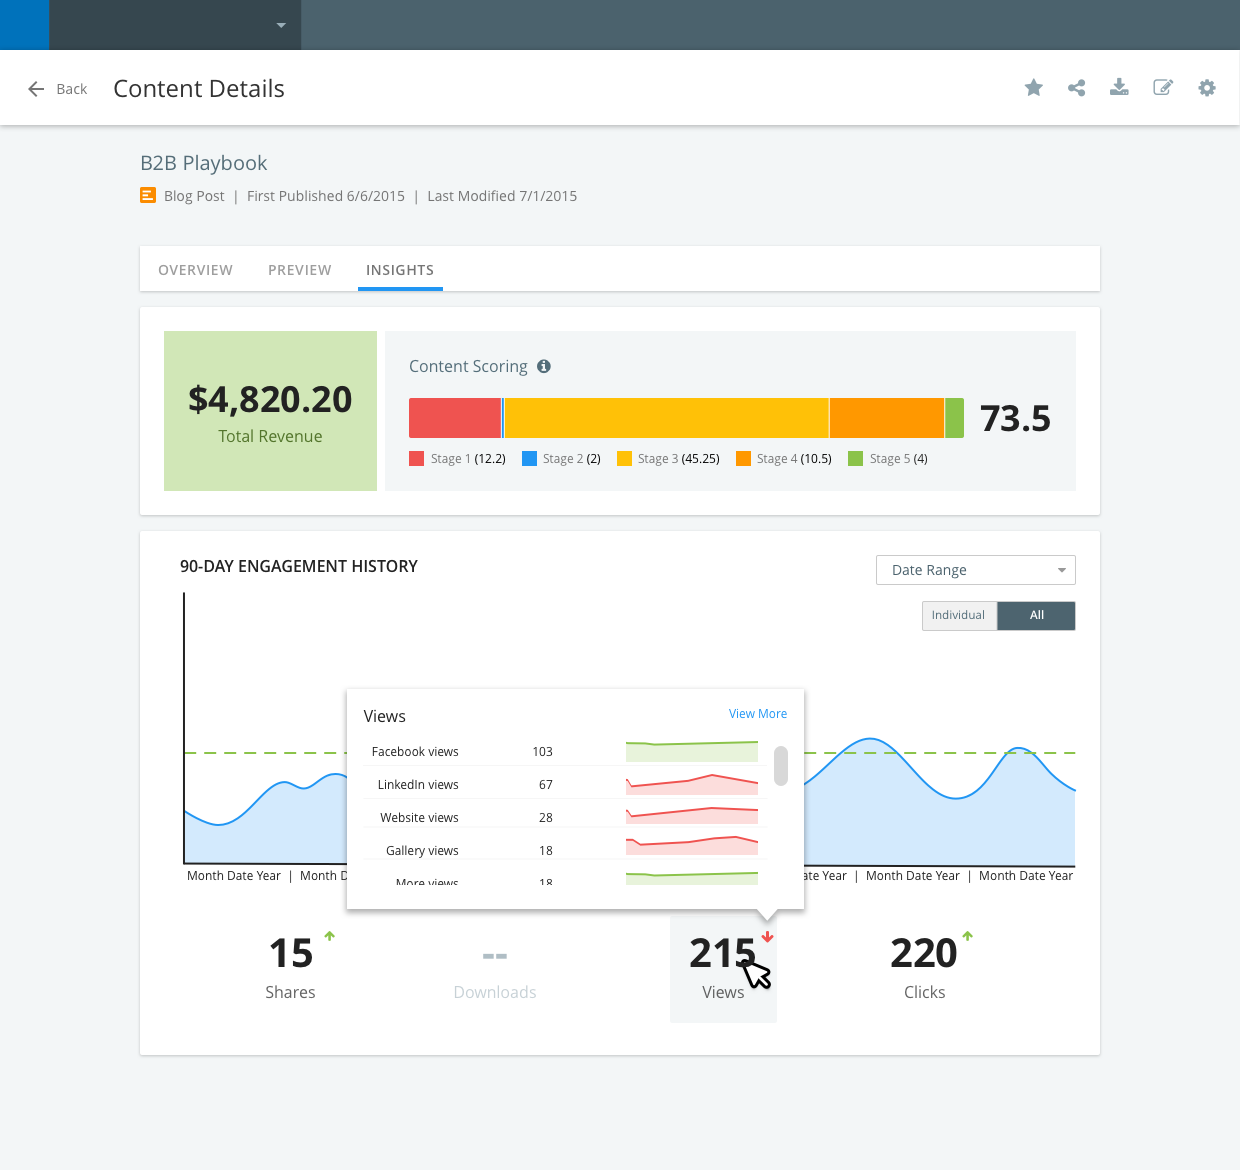
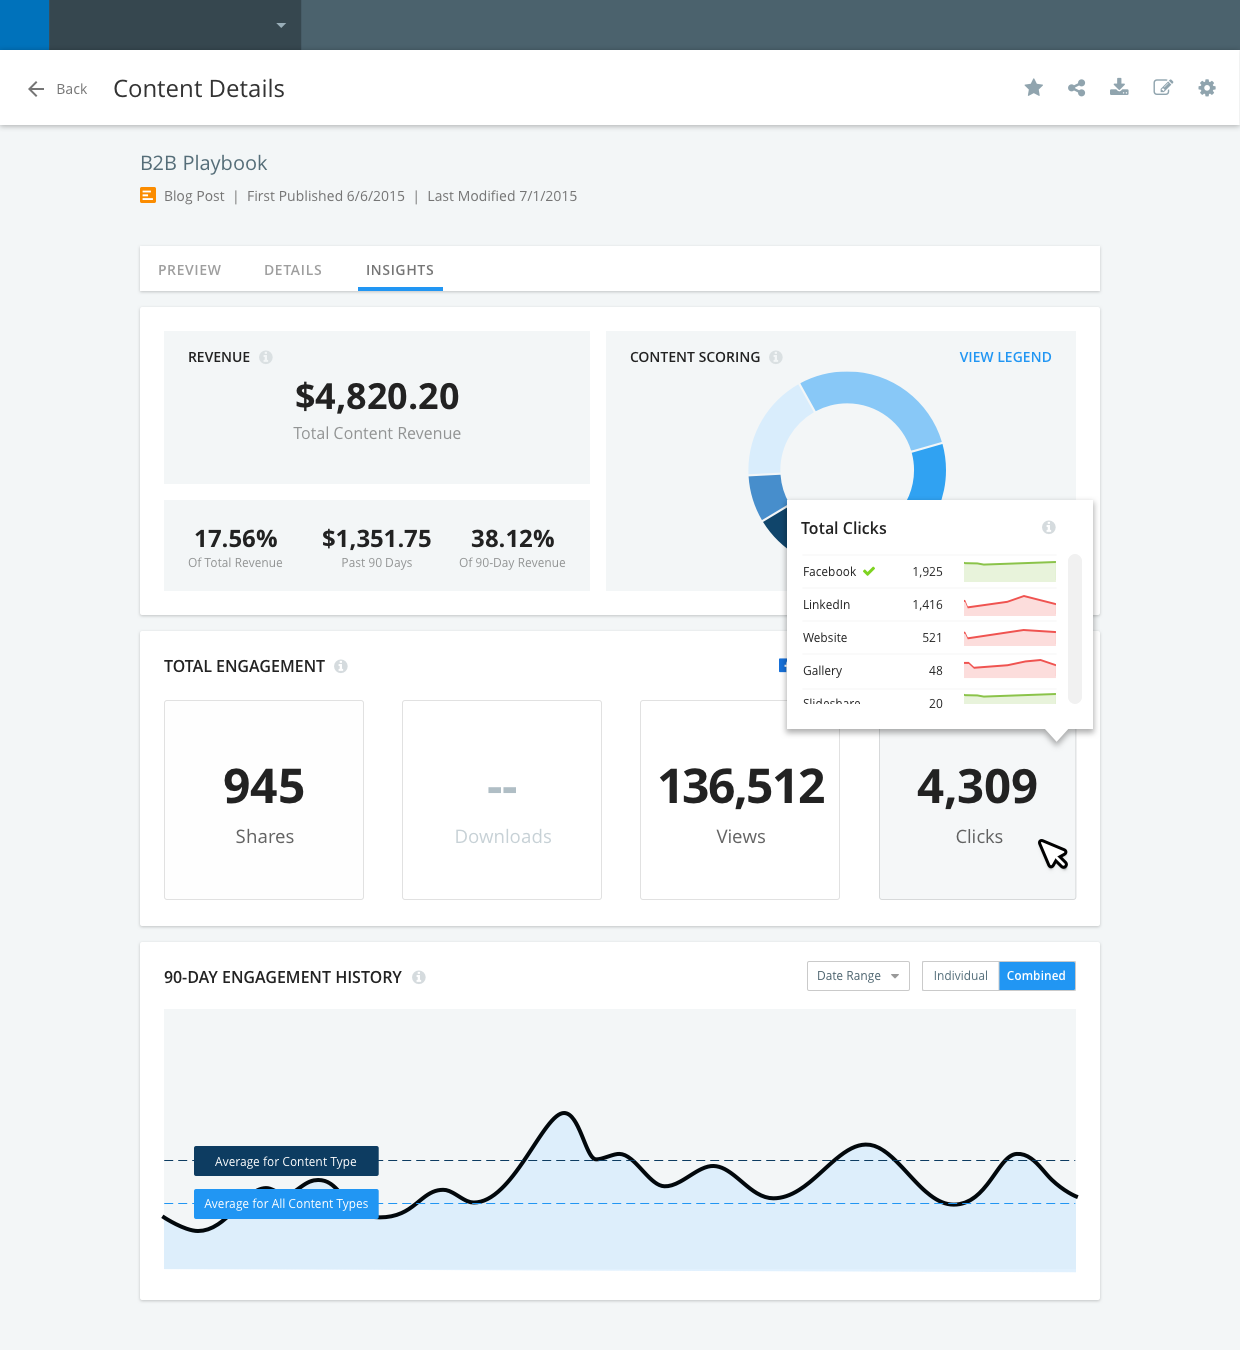
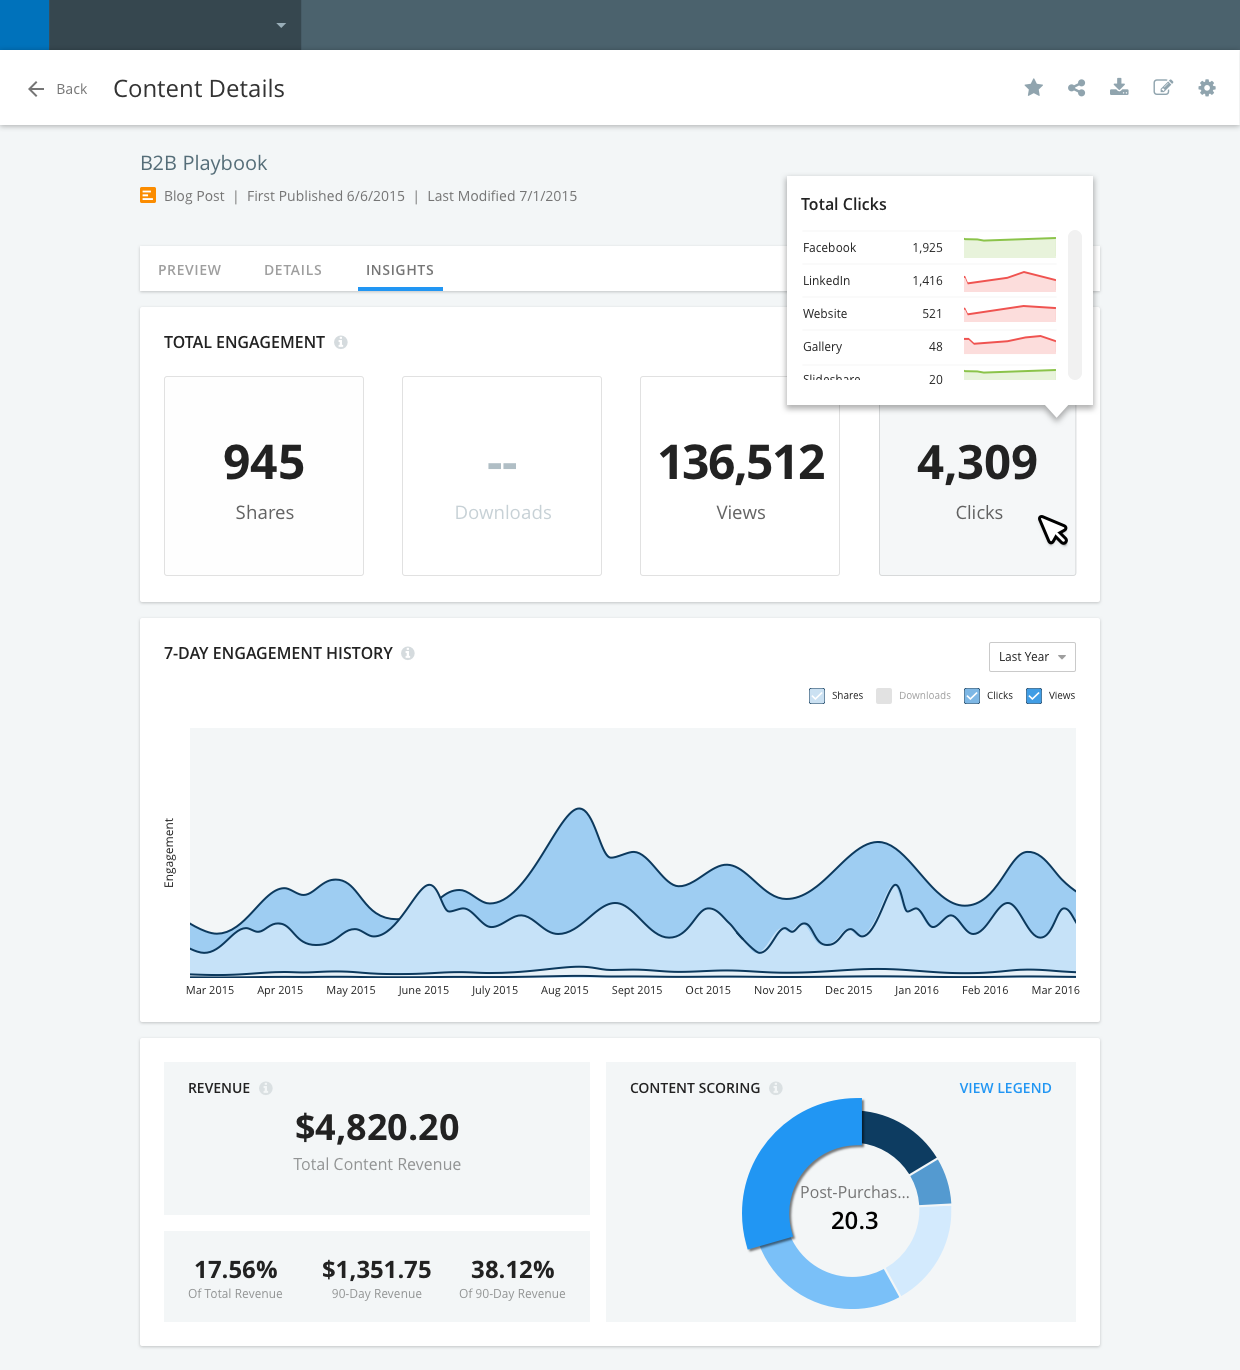
After multiple rounds of research and design (shown below), you can view one of the final screens below and a walkthrough of the project on InVision.